

An intro to fundamental analysis
Your typical investor knows that a correct price movement prediction can land them a hefty yearly bonus. The money starts to roll in when you create your own theory of why it’s going in a certain direction over a specific timeframe and then back it up with some form of evidence. For index funds and ETFs (Exchange Traded Funds), you can rest easy knowing that if a company’s ticker in the fund takes a nosedive (perhaps due the CEO appearing on a podcast smoking the ganja), then the rest of the companies in the fund will mitigate your risk to a minute percentage. This protection is gone the second you decide to invest into individual stocks, so how does one mitigate their risk while reaping the rewards of investing in the next *insert big name tech company here*.
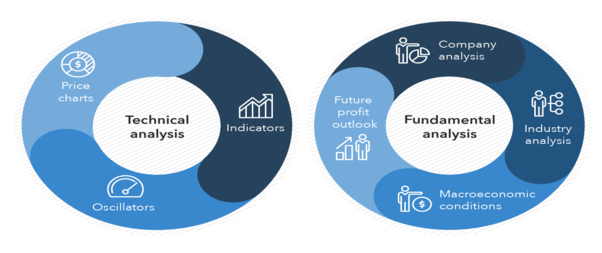 Fundamental Analysis vs Technical Analysis
 Elements of fundamental analysis
“Does the company have products or services with sufficient market potential to make possible a sizable increase in sales for at least several years?” - David Arturo Chaves
What is fundamental analysis?
As opposed to technical analysis, where you connect with your inner child and doodle charts all day (TA lords please have mercy). fundamental analysis looks at the data behind the day to day operations of the company itself. Things like the balance sheet, amount of debt the company holds, effectiveness of the company’s management team, and viability of the business model are all crucial elements of fundamental analysis. Investors use fundamental analysis to try to take an educated guess as to where the market is going. The main goal of this class of analysis can be summarized as determining whether the company is profitable and/or how long the company will stay profitable.
How to use fundamental analysis
There are a variety of metrics for determining the “fundamental soundness” of a stock. You need to decide which metrics/fundamental indicators you’re most comfortable with and commit to them for a period of time. EPS - Earnings per share takes a stock’s net income and divides it by the number of outstanding shares. EPS gives us a general sense of how the company is currently doing and is the most-watched metric when an earnings call is underway. Traders who focus on fundamental analysis are generally split into two categories.
Growth investors
Growth investors, as their name indicates, are searching for companies that are still growing rapidly. As illustrated by the struggles of companies like Uber, Lyft, Twitter, and Snapchat, very few companies start out turning a profit. Growth investors discount current revenues and instead seek out companies that are gaining momentum rapidly through VC capital or other sources of funding. Companies of these nature are often turning a loss at the end of the year but continue to grow in terms of both user base and funding. Growth investors look at metrics that estimate a company's growth over time, such as a favorable PEG (projected earnings growth), estimated EPS growth, and estimated revenue growth.
For example, high-growth technology companies like NVIDIA (NVDA) demonstrate the kind of strong revenue growth and market leadership that growth investors seek. You can analyze real-time fundamental data for stocks like NVIDIA on Stock Alarm Pro, which combines fundamental analysis with AI-powered ratings updated every 15 seconds.
Value investors
Value investors seek out older more established companies that are larger and have more assets. Value investors discount growth rates at the expense of steady dividends and relatively low prices. Value investors look for stocks with:
- Low P/E ratios—P/E ratio, or price to earnings ratio, is the current price of the stock divided by the earnings. This gives a sense of whether the stock price is justified from an earnings perspective.
- Companies with high P/E ratios are sometimes said to be overvalued while stocks with a low one is said to be undervalued. Bear in mind that a low P/E ratio in one industry may be high in another. For example, a steel company may have a low P/E ratio but when compared to a tech company, even the highest P/E ratios in the steel industry would not be able to match those in the tech industry. Companies with no earnings will not have a P/E ratio, as zero or negative earnings render the figure meaningless.
- Low price-to-book ratios—a stock’s price divided by the book value of the underlying company yields the stock’s price in relation to the book value of the company’s assets. A book value of less than 1 or between 1 and 2 are generally seen as low.
- P/S ratio, or price to sales ratio, is a metric similar to P/E ratio. But instead of comparing the price to a company’s earnings, it measures a stock's price compared to its revenue
- Stocks that have an above-average (but not too high) dividend are also preferred.
Conclusion
To (grudgingly) use a sports analogy, you can picture growth investors as college talent scouts looking to scoop up fresh athletes while value investors are coaches looking for veteran athletes in a slump that still have a good chance at redemption. No matter what type of investor you think you are, both mindsets will help you effectively find your next best investment.
Disclaimer
DO NOT BASE ANY INVESTMENT DECISION UPON ANY MATERIALS FOUND ON THIS WEBSITE. We are not registered as a securities broker-dealer or an investment adviser either with the U.S. Securities and Exchange Commission (the “SEC”) or with any state securities regulatory authority. We are neither licensed nor qualified to provide investment advice. We are just a group of students who diligently follow industry trends and current events, then share our own advice, which reflects our personal position in the market.