

Navigating through the forest
In many ways, the life of a day trader is similar to that of a prehistoric hunter. Every day, the day trader plunges into a forest of information, studies the movements of familiar beasts, ponders the best methods for their capture, and hopes, that by the time he has decided to pounce, his analysis will have led him to a worthy reward. True, we don’t speak of life and death when we venture into the stock market, but the axiom “only the fittest survive” remains true. Only a handful of those who attempt day trading breakeven after a couple of months, and of those, only a handful are successful enough to make a living out of it. So many of these traders fail because they lack the proper education. They don’t know what the tracks of their prey look like. They don’t know their chart patterns. It’s my hope that they will know a little more after this article.
Bull flags and bear flags
Amongst the “marks” that every day trader should know is the bull/bear flag. Perhaps because of its simplicity, this pattern is very well known in not just the day trading community but the investment community as a whole. The pattern consists of two components: a “flag pole” and a “flag.”
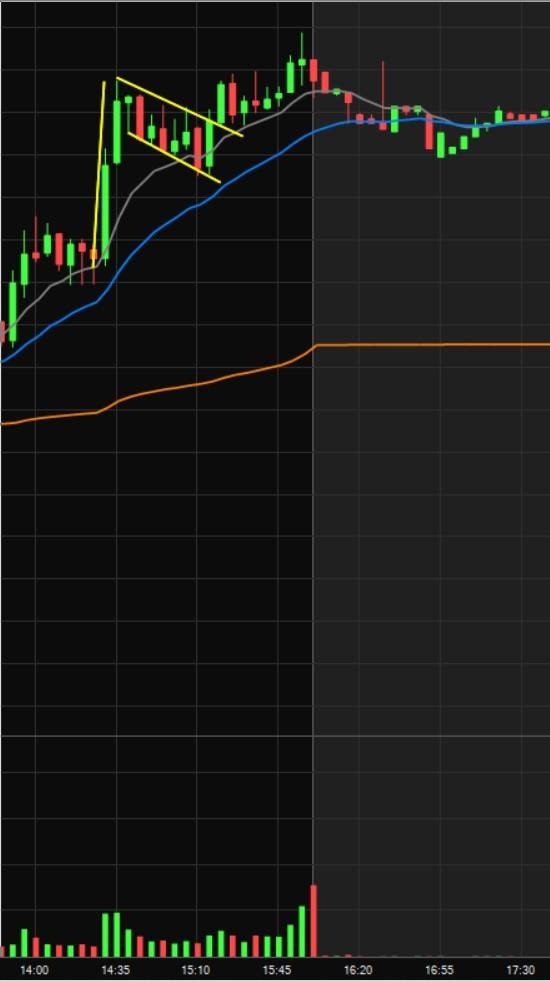 TSLA 1-minute interval bull slag
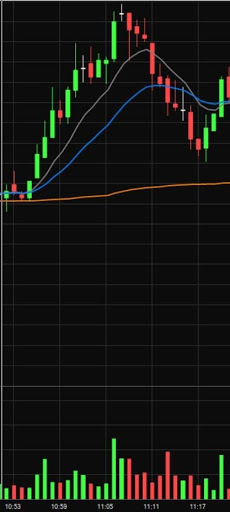
Shown above is a clear bullflag formation on TSLA’s one-minute chart. Note the flag pole, composed of two, large green candles indicating strong bullish sentiment. Observe the flag, composed of a mixture of green and red candles which pull the price down between the 9 EMA (in grey) and 20 EMA (in blue). Long-biased traders use this “mark” to locate opportune entries to the long side.
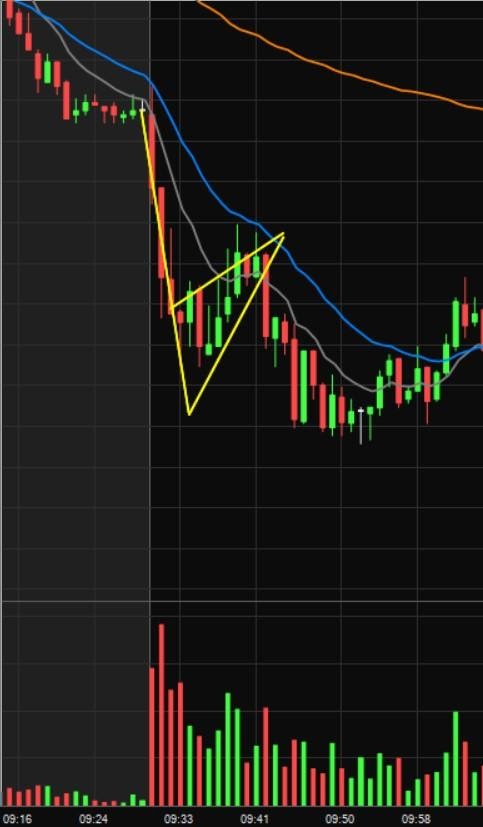 WATT 1-minute interval bull slag
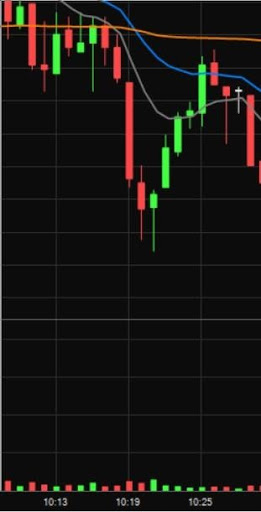
Shown above is a clear bear flag formation on WATT’s one-minute chart. Note the flag pole, which consists of four strong red candles. Observe the flag formed by the mixture of red and green candles that bring the price up towards the 9 and 20 EMAs. Short-biased traders use this “mark” to identify opportune entries. Keep in mind that bear and bull flags are inverses – they are exactly the same pattern, but each moves in the opposite direction.
Bull and bear flags are “tracks” that every hunter of the stock market should know. Not only because of their frequency, but also because of their many derivatives. The ABCD, 1234, and pennant patterns, for example, are just some variations from this source. A good hunter would do well to get acquainted with all of them, but knowing the source – the bull & bear flag – is a must.
Flat tops and flat bottoms
Flat tops and flat bottoms are amongst the most easily recognized and well-respected patterns in the day trading community. They are found almost every day, and traders use them to identify strategic entries for both long-biased and short-biased movements. Much like bull and bear flags, flat tops and bottoms are inverses of one another. We will discuss and see each below.
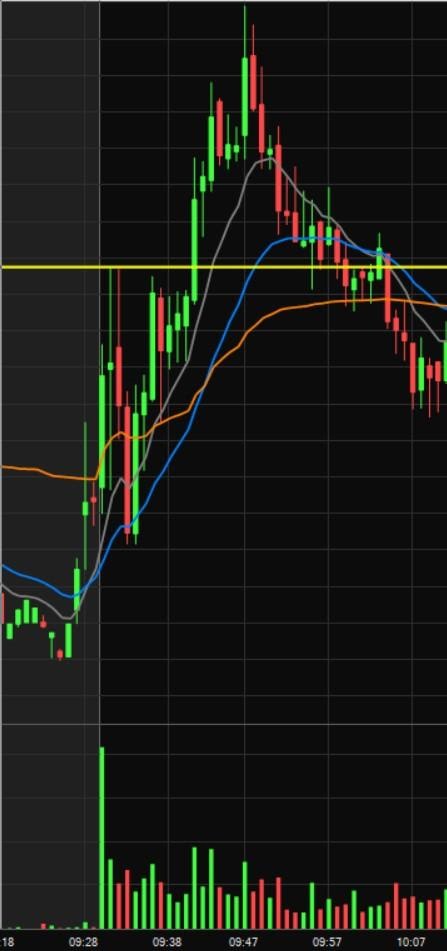
The snippet above is from TESLA’s one-minute chart. The flat top pattern is characterized by a resistance level that has failed to break at least twice – this is indicated by the yellow line. In this particular example, the second and third candles after the market open meet resistance at the same price, and the stock fails momentarily afterwards, sinking to lower levels. It makes a quick recovery, however, and goes back to test the flat top. It eventually breaks it and surges to higher levels.
This snippet is from VCNX’s one-minute chart. Opposite to the flat top, the flat bottom is characterized by a support level that has failed to break at least twice. In this particular case, this support level is tested three times, once even breaking beyond that support but not holding that break. The stock experiences a price rise after this failed break, but then quickly flushes. At the fourth attempt, this support level breaks, and we get significant movement to the downside.
Channels and wedges
As we’ve seen from flat tops and bottoms, support and resistance levels play a key role in pattern formations. Learning to spot and use resistance and support is as fundamental to a stock market hunter as learning the distinction between prey and predator is to a hunter. Resistance to a long-biased trader, for example, is a threat to the day trader’s survival, much like a predator is to a hunter. Similarly, support to a long-biased trader is an aid to his survival, much like prey is an aid to a hunter’s. Channels and wedges are a method to use resistance and support in a day trader’s favor.
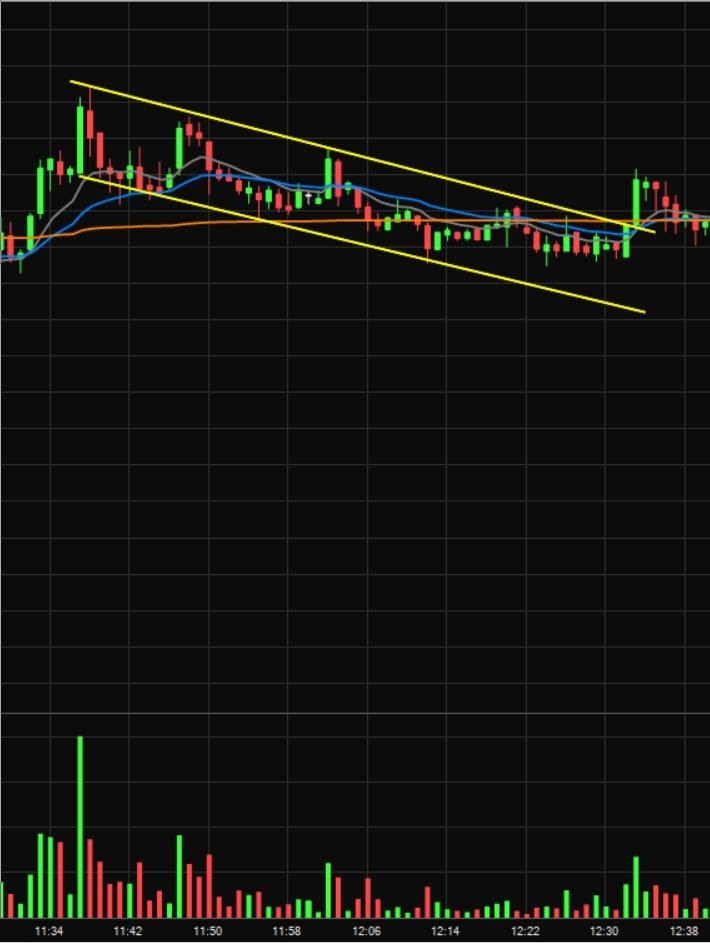
Above is a descending channel on EOLS’s one-minute chart. The upper yellow line represents the resistance line. It’s composed of at least two points where the stock finds “resistance,” indicated by its inability to surge higher than that price level. In this case, our resistance line is composed of four separate points, showing this line is valid and well-respected. The lower yellow line, on the other hand, represents the support line, and follows the same concept but in reverse. The line is composed of at least two points where the stock was unable to break lower than that price level. Put these two lines together, and one forms a channel – in this case, a descending one, showing lower highs and lower lows. Many traders use channels to establish trends and to formulate entry strategies based on the break of either resistance or support.
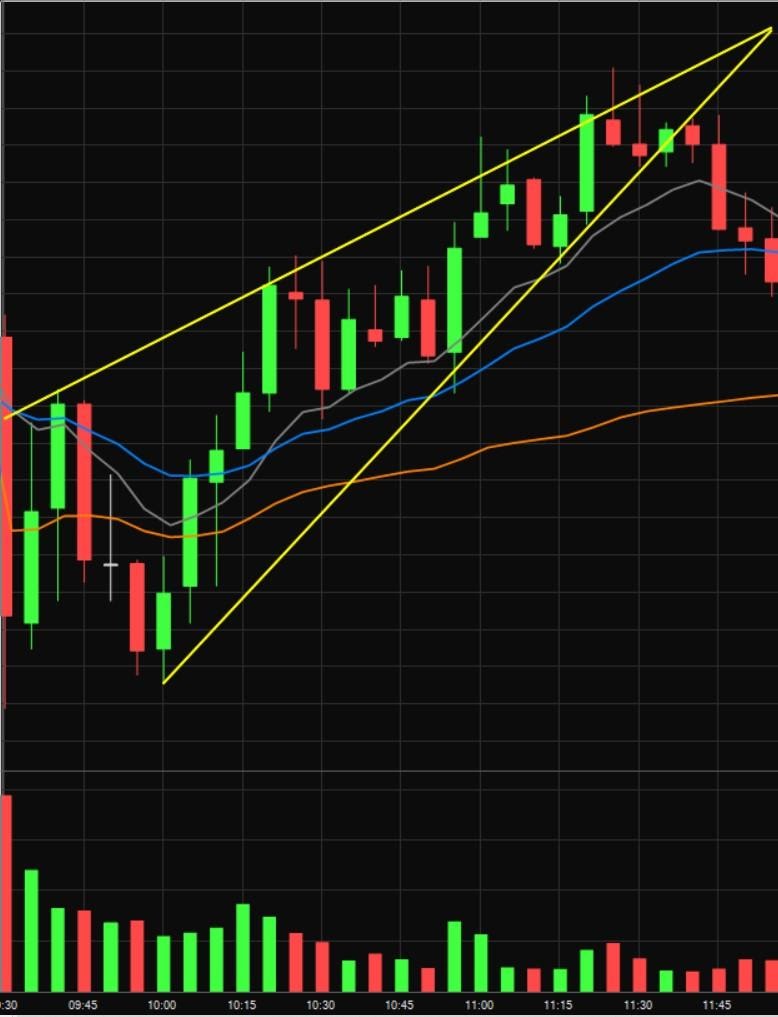
Support and resistance don’t always come in the form of parallel lines. In the one-minute chart of AMD, located above, the support and resistance lines actually converge. When these converge, the resulting pattern is called a wedge, and its direction, up or down, determines whether it’s an “ascending” or “descending” wedge. Similar to channels, the upper line on a wedge determines resistance, while the lower line determines support, and the clear break of either of those levels is often used by traders as entry indicators.
Like bull and bear flags, channels and wedges are used extensively by traders and have a wide variety of derivatives. Unlike bear and bull flags, however, perceiving wedges and channels requires some artistry, as each trader can draw a wedge or channel using different support and resistance levels. Because of this uncertainty, certain channels and wedges may not be as respected as others. For this reason, while it’s vital to know these patterns, one must be careful when using them.
Reversals: DOJI and hammer candles
While the day trader is typically concerned with micro activities, shifts in trends are nonetheless pertinent to their survival. The hunter must notice when his game has shifted its tracks. So too must a day trader know when his stock is about to change its course. And while there are many methods and tools used to determine this shift, the most relevant and easy-to-spot indicators come in the form of candles.
Take this clip of the SPY’s one-minute chart. There are three important things to notice here. First is the upward trend signified by the many green candles on the left-hand side of this picture. Second is the doji candle at the very top of this trend (the encircled candle). This is our reversal indicator, signifying indecision at a critical level. Third is the confirmation of this hesitation demonstrated by the overwhelming number of red candles that succeed the doji candle. A reversal has taken place. A shooting-star candle at the top of an upward trend is also a reversal indicator and shares a strong resemblance to the doji candle.
This snippet of AAPL’s one-minute chart shows a similar story. The stock is in a downward trend, breaking below support levels and pushing the price further down. The trend continues until a hammer doji (encircled) presents itself at the very bottom of the trend. What follows is a momentary reversal of the trend, as the stock makes a move back towards support. Here, the hammer candle fulfils its role as a reversal indicator.
Patterns are not strategies
While patterns are essential to a day trader's survival, they mean nothing without a proper plan and strategy. A hunter can very easily learn the track of every animal in the forest, but if he doesn't know how to deal with the animal, he will never survive. It's the same story with day traders. Learning these patterns will take you one step closer to survival, but they're not sufficient on their own.
Modern traders combine pattern recognition with AI-powered analysis to identify high-probability setups. For example, you can analyze real-time chart patterns and AI ratings for actively traded stocks like Tesla (TSLA), Apple (AAPL), and AMD on Stock Alarm Pro's professional screener. This combination of technical analysis and AI-driven insights helps you validate your pattern-based strategies with real-time data.
Disclaimer
DO NOT BASE ANY INVESTMENT DECISION UPON ANY MATERIALS FOUND ON THIS WEBSITE. We are not registered as a securities broker-dealer or an investment adviser either with the U.S. Securities and Exchange Commission (the “SEC”) or with any state securities regulatory authority. We are neither licensed nor qualified to provide investment advice. We are just a group of students who diligently follow industry trends and current events, then share our own advice, which reflects our personal position in the market.