

Foreword
Technical analysis is a trading framework used to evaluate investments and identify entry/exit opportunities in the market. This methodology uses statistical trends gathered from trading activity, metrics used include price movement, momentum, and volume.
In statistics, a moving average is a calculation used to analyze data points by creating a series of averages over a variety of periods. Moving averages are used heavily in technical analysis with the most popular being Simple Moving Averages (SMA) & Exponential Moving Averages (EMA).
 “Entry and exit points are vital parts of trading and investing. That is worth repeating. Entry and Exit points are vital parts of Trading and Investing. Whether you are Day Trading, Swing Trading, or are a Long Term Investor. Why would you ever buy a stock at the wrong time? Unfortunately, there are many market participants with no training that do it every day.” - Fred McAllen, Charting and Technical Analysis
Definition
Moving averages are one of the core indicators in technical analysis, and there are a variety of different versions. The average is called "moving" because it is plotted on the chart bar by bar, forming a line that moves along the chart as the average value changes.
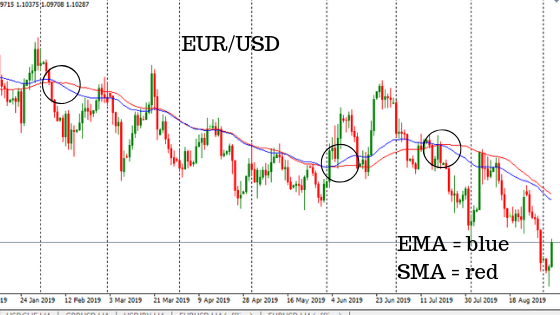
An exponential moving average (EMA) is a type of moving average (MA) that places a greater weight and significance on the most recent data points. Exponential moving averages react more violently to recent data points when compared to simple moving averages. Like all moving averages, EMAs are used to produce buy and sell signals based on crossovers and divergences.
Indicator and direction
The EMA weights recent prices higher than older prices while the SMA assigns an equal weight to all input values. The weighting given to the most recent price is greater for shorter-period EMAs than longer-period EMAs, this is in part due to less dilution from older values. For example, an 18.18% multiplier is applied to the most recent price data for a 10-period EMA, whereas for a 20-period EMA, only a 9.52% multiplier weighting is used. There are also slight variations of the EMA arrived at by using the open, high, low or median price instead of using the closing price.
The 12- and 26-day exponential moving averages are usually the most popular short-term averages as they’re used to create more complicated indicators such as moving average convergence divergence indicators as well as bullish & bearish crossovers. The 50, 100, and 200-Day EMA’s are used as long-term trend indicators. For example, when a stock crosses its 200-Day EMA, it’s a technical indicator that a reversal has occurred. Most traders who rely on technical analysis find exponential moving averages insightful when applied correctly. The issue arises from improper extrapolation of the data as all moving averages are lagging indicators. Conclusions drawn from EMAs should only be used to solidify conclusions or market movements.
Significance
EMAs are better suited for trending markets. When the market is in a sustained uptrend, the EMA line will show an uptrend and vice versa for a downtrend. EMAs are commonly used in conjunction with other indicators to confirm market movements and to gauge their momentum. The EMA indicator appeals to traders who trade in fast-moving or intraday markets, it’s used quite often to determine a trading bias.
Limitations
The trading community continues to disagree over whether more emphasis should be placed on the more recent days in the time period or weighted evenly. Many believe that new data will better reflect the current trading climate surrounding the security while others feel that privileging certain dates will bias the indicator. The EMA relies wholly on historical data which causes some discussion as many economists believe that markets are already efficient – that is, that current prices reflect all available information and that events are already “priced in”.
Disclaimer
DO NOT BASE ANY INVESTMENT DECISION UPON ANY MATERIALS FOUND ON THIS WEBSITE. We are not registered as a securities broker-dealer or an investment adviser either with the U.S. Securities and Exchange Commission (the “SEC”) or with any state securities regulatory authority. We are neither licensed nor qualified to provide investment advice. We are just a group of students who diligently follow industry trends and current events, then share our own advice, which reflects our personal position in the market.